The Fluke OptiView XG is the first tablet specifically designed for the network engineer. It automates root-cause analysis of wired and wireless network and application problems allowing the user to spend less time on troubleshooting and more time on other initiatives. It is designed to support the deployment and troubleshooting of new technologies, including unified communications, virtualization, wireless and 10 Gbps Ethernet. The result is that new initiatives get up and running faster and networks stay productive even in these days of smaller teams.
Core Capabilities:
- Network Analysis – Automated discovery, monitoring, mapping, analysis and guided troubleshooting of your network infrastructure
- Traffic and Packet Analysis – The ONLY tablet with 10 Gbps “On the wire” analysis
- Wireless Analysis – Integrated tools for deployment and troubleshooting of 802.11a/b/g/n/ac WLANs
- Performance Testing – Conduct network assessments, validate new infrastructure and devices, test service provider SLAs and QoS, and
troubleshoot problems from end to end, at up to a full line-rate of 10 Gbps
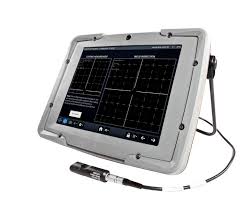
The OptiView XG’s unique tablet form factor provides the mobility to connect, analyze and troubleshoot anywhere in the network – at the desk, in the data center, or at the end user location. It can quickly analyze the performance and health of devices, interfaces and paths on your network— which moves beyond traditional LAN/WAN switching and routing to a true network fabric that incorporates heterogeneous physical devices, wireless networks, virtualized servers and networks.
- Integrates the latest wired and wireless technologies with powerful dedicated hardware in a unique tablet form factor providing mobility to connect, analyze and solve network and application problems anywhere on the network
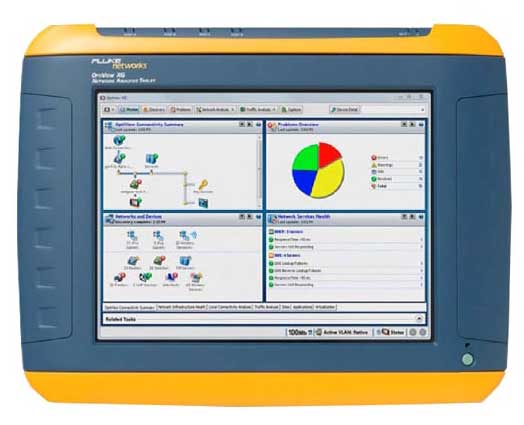
- Displays your network exactly the way you want to see it through intuitive, customizable dashboards
- Provides performance testing, ‘on-the-wire’ and ‘in-the-air’ automated analysis up to 10 Gbps
- Enables proactive analysis by analyzing the information you need before problems arise
- Out-of-the-box and customizable reports
Traffic and Packet Analysis – Highlights
- Ensures line-rate packet capture up to 10 Gbps for troubleshooting difficult application problems
- Performs application-centric analysis with a high-level view of the applications on the network with easy drill down capability
- Real-time traffic analysis shows top hosts, top conversations, top protocols – who is using your bandwidth
- Go directly in-line (up to 1 Gbps) to observe traffic in real-time or capture at line rate without the need of an external tap
- Sequential store-to-disk allows for multiple, sequential captures to be stored to the OptiView XG analyzer’s internal disk or to an external
storage device to capture for longer periods or to capture multiple trigger events.
Troubleshooting End-user Experience and Application Performance
The ONLY Tablet with 10 Gbps “on-the-wire” Analysis
OptiView XG provides line rate, real-time application and traffic analysis and troubleshooting on 10/100/1000 Mbps or 10 Gbps links.
Identify top talkers, multicasters and broadcasters or select top conversations to determine which hosts may be over-utilizing resource bandwidth. Tap or span key links to determine who is using server bandwidth by viewing top conversations to a single host. Analyze protocol mix to identify top protocols being used and also discover unwanted and custom protocols and see which protocols are being used by each host. These real-time statistics for traffic “on-the-wire” enable you to understand how network resources are being used and increase user satisfaction with faster response times for networked applications.
OptiView XG automatically discovers all protocols and sub-protocols from the MAC layer to the application layer. This enables IT staff to identify applications (including those that use dynamically assigned port numbers) utilizing link bandwidth to see and validate the impact of applications on network resources and also identify illicit applications. Deep packet inspection differentiates between specific audio, video, image and data applications, and shows the level of bandwidth usage for each.
VLAN Visibility and Trunk Analysis
Only “on-the-wire” analyzers provide vision into actual VLAN trunk traffic. When connected to a switch trunk port, the OptiView XG detects all VLANs available on that trunk, measures the traffic distribution across all the VLANs and provides the user with the capability of selecting a specific VLAN. If an individual VLAN is selected, device discovery, traffic statistics and packet capture data will be displayed only for that VLAN.
Application-centric Analysis
Application issues are difficult to solve and slow performance or outages have serious implications for the business. It is critical to get a view of traffic captures in terms of applications on the network to easily identify bottlenecks. OptiView XG provides a comprehensive, high-level overview of the health of applications on your network with easy-to-use drill down capabilities to gain access to more detailed information.
- Full Line-Rate Capture Ensures Complete Analysis
- Go “In-Line” to Get to Root Cause
- Capture and Store Multiple Trace Files
- Free String Match to Find and Capture Anything
- Multi-Segment Analysis Speeds and Simplifies Troubleshooting Application Slowdowns
- Simplified Troubleshooting of Application Problems
- Automated Problem/Issue Detection
- Unique and Powerful Bounce Chart Illustrates Application Flow
- Content Reconstruction and Playback
Leave a Reply