What is Spectrum analyzers?
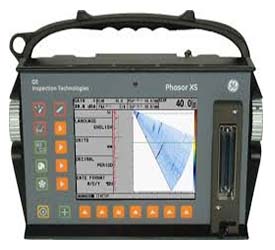
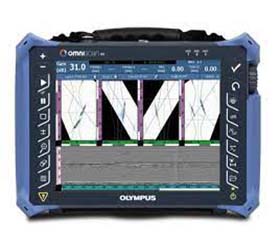
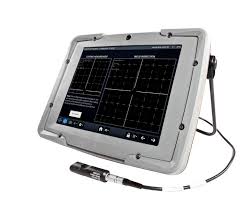
A spectrum analyzer is a device used to examine the spectral composition of electrical, acoustic, or optical waveform. It measures the magnitude of an input signal versus frequency within the full frequency range of the instrument.
In simpler terms, it’s a tool that allows you to see the different frequencies that make up a signal. The ‘spectrum’ refers to the range of frequencies that the tool can detect. This is useful in a variety of fields, including telecommunications, radio broadcasting, and even in audio production.
Spectrum analyzers are designed to measure the power of the spectrum of known and unknown signals. These measurements can include noise, spurious signals, harmonics, intermodulation distortion, and other signals that might be embedded in the primary signal.
The spectrum analyzer, like an oscilloscope, is a basic tool used for observing signals. Where the oscilloscope provides a window into the time domain, the spectrum analyzer provides a window into the frequency domain, as depicted in the display’s vertical axis and horizontal axis respectively.
As of my knowledge cutoff in September 2021, there are two main types of spectrum analyzers: analog and digital. Analog analyzers (also called swept-tuned analyzers) work by sweeping the point of focus along the frequency, allowing you to observe the power at any specific frequency. Digital analyzers, on the other hand, use signal processing to convert a digital version of the signal into the frequency spectrum. Each type has its own benefits and is used for different purposes.
There are several types of spectrum analyzers. While they all serve the same basic function, which is to measure and display signal amplitude as it varies by frequency, the different types have unique characteristics and are best suited to different applications. As of my last update in 2021, the most commonly used types are:
- Swept-Tuned (or Superheterodyne) Spectrum Analyzers: This type of analyzer “sweeps” through a range of frequencies and measures the power at each frequency. The sweeping is done by a voltage-controlled oscillator. It’s often used in radio frequency testing.
- Vector Signal Analyzers: These devices not only measure the amplitude of the signal at each frequency but also the phase of the signal. They often use digital signal processing to capture and measure complex modulated signals, and are often used in telecommunications applications.
- Real-Time Spectrum Analyzers: These devices capture the signal in real time, without needing to sweep through frequencies. They offer the advantage of being able to capture and measure transient events that may be missed by swept-tuned analyzers.
- Audio Spectrum Analyzers: These devices are specifically designed for audio frequency applications. They can measure frequencies in the audio range (20 Hz to 20 kHz), and are often used in sound engineering and acoustics
- Optical Spectrum Analyzers: These devices are used to measure light signals. They are commonly used in optical communication, which uses light to transmit information.
- RF Spectrum Analyzers: These are used specifically for RF (radio frequency) applications. They can measure signals in the radio frequency range, and are commonly used in wireless communication and broadcasting.
What is the Spectrum analyzers used for ?
Spectrum analyzers have a variety of applications across many different fields. Their primary purpose is to measure and analyze the frequency spectrum of electrical signals. Here are some common uses:
- Telecommunications: Spectrum analyzers are used to ensure that telecommunications systems are operating on the correct frequencies and that their signals are clean, without too much noise or interference. They can also be used to identify sources of interference.
- Radio Broadcasting: In radio broadcasting, spectrum analyzers are used to ensure that a station is broadcasting on its assigned frequency and that it is not encroaching on the frequencies assigned to other stations. They can also measure the quality of the broadcast signal.
- Wireless Technology: Spectrum analyzers play a crucial role in developing and troubleshooting wireless technologies, such as Wi-Fi, Bluetooth, and cellular networks. They are used to measure signal strength, identify sources of interference, and test the performance of wireless devices.
- Audio Production: Audio spectrum analyzers are used in sound engineering to measure and visualize the frequency content of audio signals. This can help sound engineers balance the mix of frequencies in a recording or live performance.
- Research and Development: In R&D, spectrum analyzers are used to test and characterize electronic devices, systems, and networks. They can help engineers understand the behavior of a device under different conditions and identify any problems or anomalies.
- Maintenance and Troubleshooting: Spectrum analyzers can be used to identify and diagnose problems in electronic systems. For example, they can help identify a malfunctioning component in a complex system by showing that the system’s output signal differs from what’s expected.
- Optical Spectrum Analysis: Optical spectrum analyzers are used in the field of optics and photonics to measure light signals. They are commonly used in optical communication, which uses light to transmit information.
How does Spectrum analyzers works?
A spectrum analyzer works by processing an input signal and providing an output that represents the signal in the frequency domain. It displays the amplitude of the signals on the y-axis and the frequency on the x-axis. Here’s a simplified explanation of the process:
- Input Signal: The process begins when the signal to be analyzed is fed into the spectrum analyzer.
- Bandpass Filters: The input signal is passed through a bandpass filter, which is set to allow a certain frequency range through and block others.
- Sweeping: In a traditional swept-tuned (or superheterodyne) spectrum analyzer, the center frequency of the bandpass filter is varied (‘swept’) across the desired frequency range.
- Detection and Conversion: The output of the filter (a ‘slice’ of the input signal in a particular frequency range) is then detected and converted into a digital format, if it’s not already.
- Fourier Transform: A mathematical process called the Fourier Transform is used to convert the time-domain signal into a frequency-domain representation.
- Display: The amplitudes of the various frequency components are then displayed, usually in a graph format with frequency on the x-axis and amplitude on the y-axis.
Keep in mind that this is a very simplified explanation and that actual spectrum analyzers can be quite complex, especially when dealing with advanced features like phase measurement, real-time analysis, and digital demodulation. Furthermore, newer real-time spectrum analyzers can simultaneously analyze all frequencies in a given bandwidth. They continuously capture time-domain signals and convert them into the frequency domain using digital signal processing techniques. This allows them to catch transient or rapidly changing signals that a traditional swept-tuned analyzer might miss. In all cases, the goal is to create a visual representation of the signal where the intensity of each frequency component is displayed as a function of frequency, providing insight into the spectral composition of the signal.


Leave a Reply